
前言
最近一直在恶补网络有关的知识,主要在学习如何分析网络丢包以及网络性能优化。会分成两篇来总结,第一篇先总结下网络丢包,对于 DBA 来说,网络和数据库息息相关,我碰到因为丢包导致莫名其妙的流复制冲突,也遇到过丢包导致 PostgreSQL 性能骤降的案例,因此作为全干工程师,掌握基本的网络分析技能是十分重要的!
协议
首先是耳熟能详的协议了,也是了解入门网络的基础之一。就如同人与人之间相互交流是需要遵循一定的规则一样,计算机之间的相互通信也同样需要遵守一定的规则,这些规则就是网络协议。
以 OSI 标准模型为例,分为物理层、数据链路层、网络层、传输层、会话层、表示层和应用层。
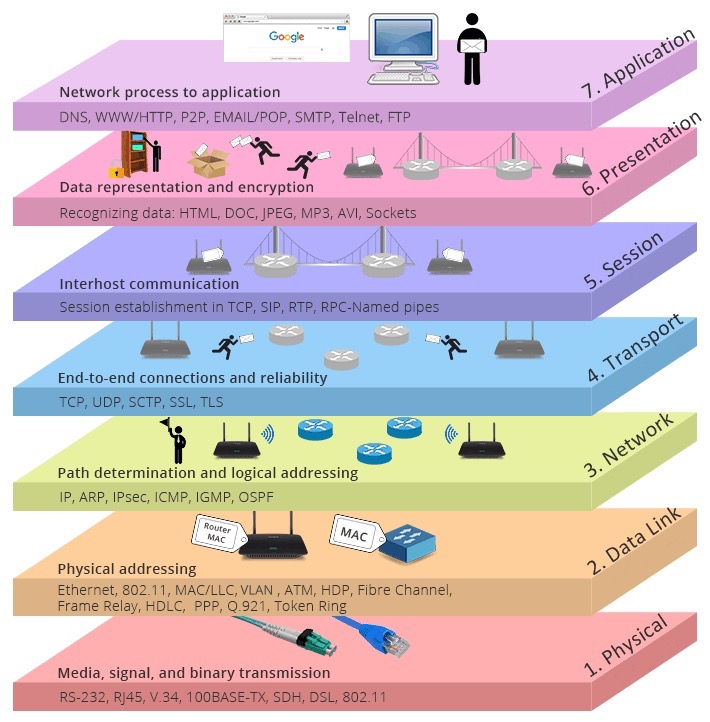
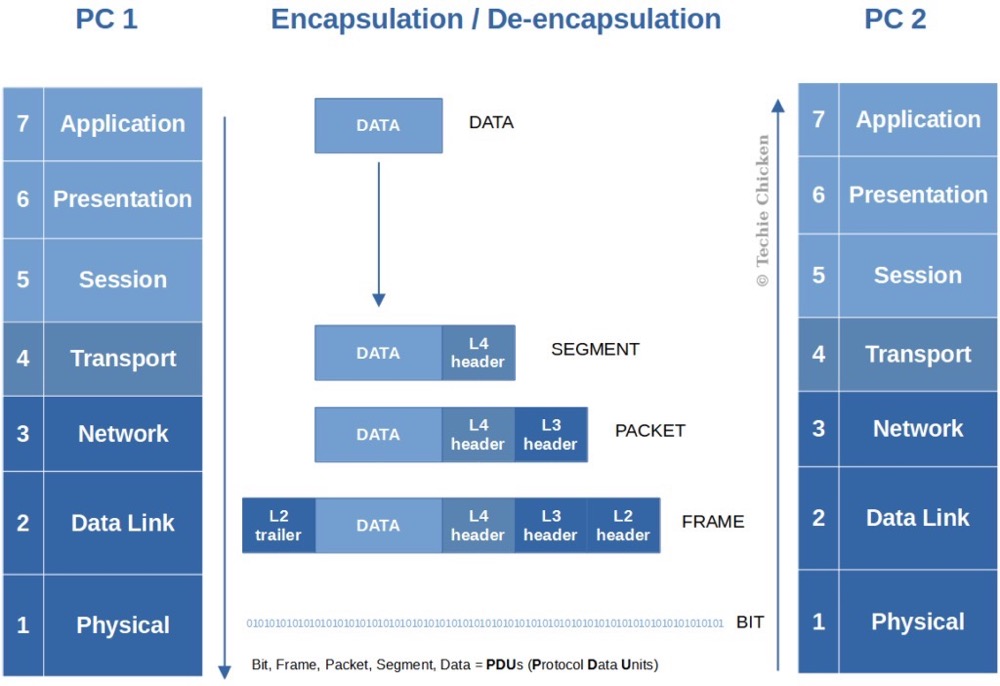
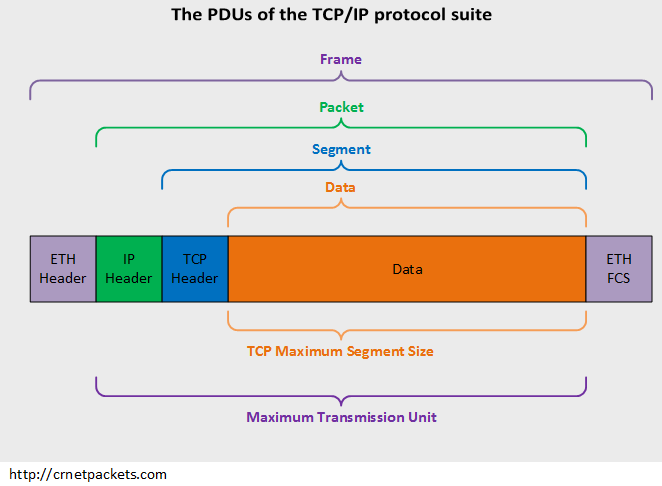
每一层都有自己的功能,各司其职,就像建筑物一样,每一层都靠下一层支持,每一层传输单位都有不同的名词,数据链路层的传输单位是帧,IP 层的传输单位是包,TCP 层的传输单位是段,HTTP 的传输单位则是消息或报文,这些名词可以统称为数据包。参照下图👇🏻
物理层确保原始的数据可在各种物理媒体上传输,可以用光缆、电缆、双绞线、无线电波等方式
数据链路层在不可靠的物理介质上提供可靠的传输,采用差错检测、差错控制和流量控制等方法,向网络层提供高质量的数据传输服务,对于网络层,由于链路层的存在,而不需要关心物理层具体采用了那种传输介质和通信设备,主要协议是以太网 (Ethernet)。以太网规定,一组电信号构成一个数据包,叫做”帧” (Frame) ,数据帧不是无限大的,数据帧长度受 MTU 限制,我们可以通过 ifconfig 看到,如果本机的 MTU 值大于网关的 MTU 值,大的数据包就会被拆开来传送,这样会产生数据包的碎片,增加丢包率,降低网络速度;把 MTU 设置比网关小或者相同,可以减少丢包
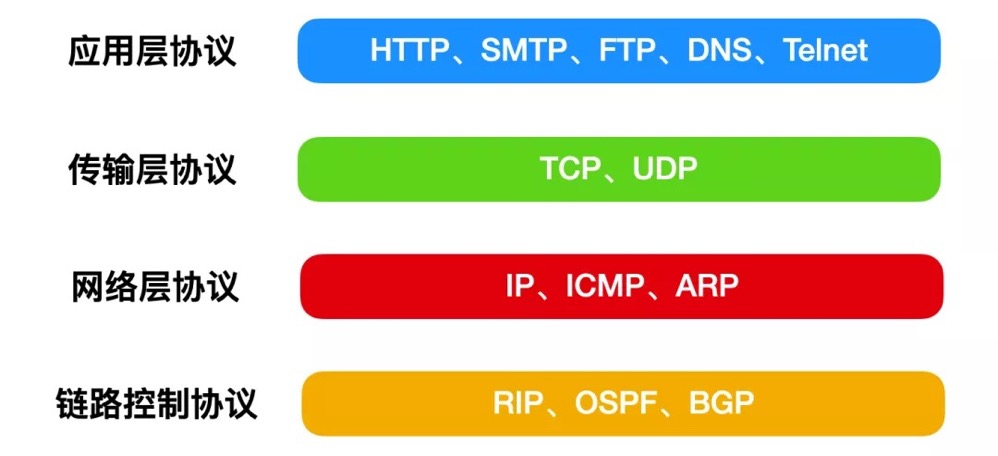
网络层,最熟悉的就是 IP 协议了,将数据传输到目的地址,主要负责寻址和路由选择,与 IP 协议配套使用实现其功能的最常用的就是 ICMP 了,常用在 ping、网络故障的排查和 traceroute:探测 IP 数据报在网络中走过的路径,IP 层的传输单位是包 (packet)
传输层,有两个传输协议,分别是 TCP 和 UDP,大部分应用使用的正是 TCP 传输层协议,TCP 相比 UDP 多了很多特性,比如流量控制、超时重传、拥塞控制等,这些都是为了保证数据包能可靠地传输给对方。 UDP 就相对很简单,简单到只负责发送数据包,不保证数据包是否能抵达对方,但它实时性相对更好,传输效率也高。当传输层的数据包大小超过 MSS (TCP 最大报文段长度),就要进行分块,每个分块称为一个”段” (TCP segment)
会话层,主要是管理和协调不同主机上各种进程之间的通信 (对话),即负责建立、管理和终止应用程序之间的会话。网络文件系统 (NFS) 和服务器消息块 (SMB) 是会话层的常用协议。
表示层,负责数据格式的互相转换,如编码、数据格式转换和加密解密等,保证一个系统应用层发出的信息可被另一系统的应用层读出。
应用层,OSI 标准模型的最顶层,是直接为应用进程提供服务的。包括文件传输、电子邮件远程登录和远端接口调用等协议。
网络收发流程
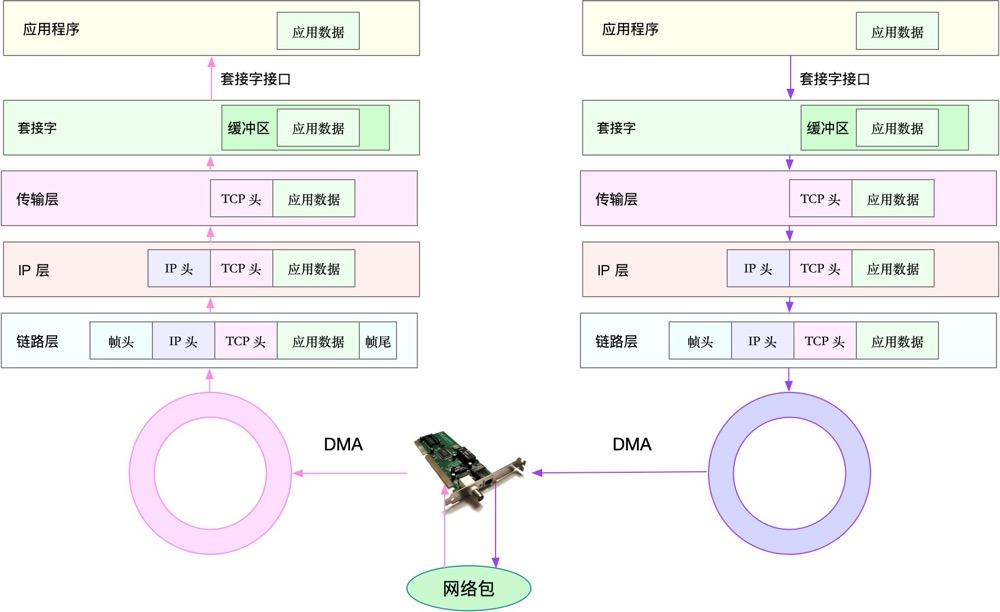
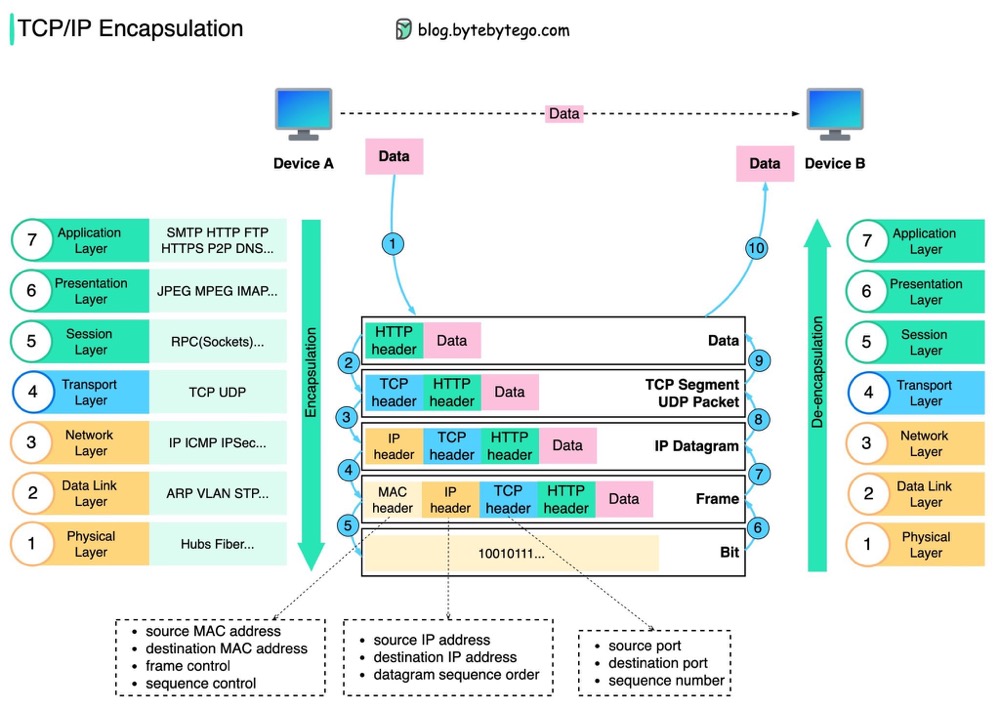
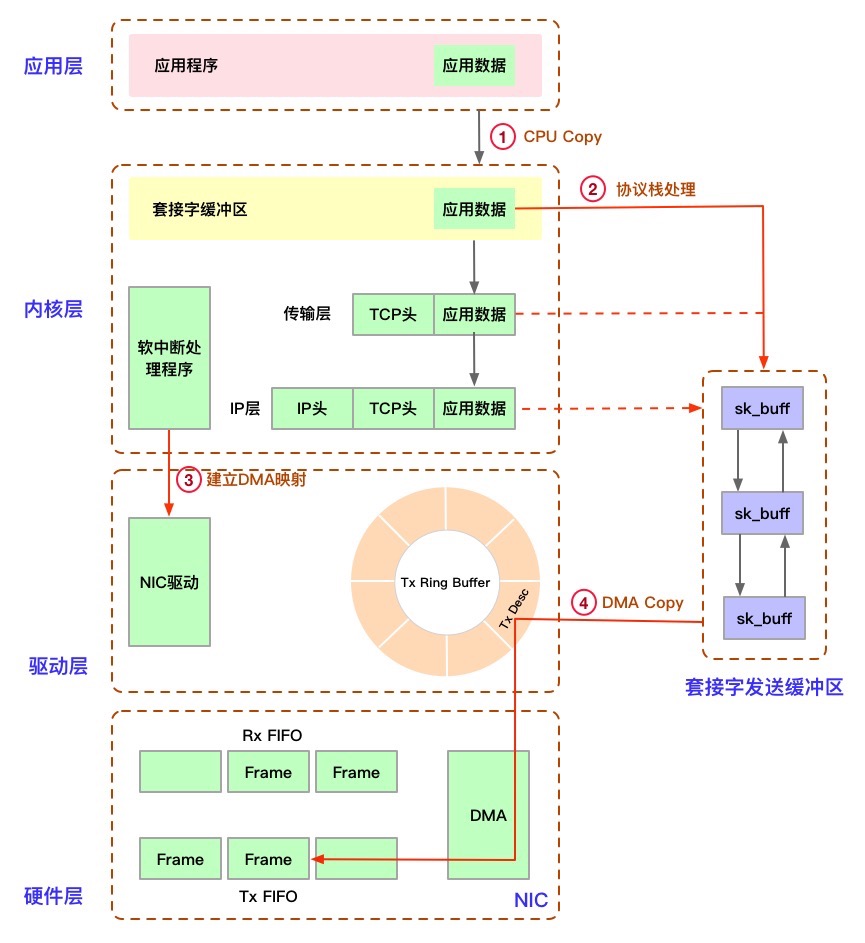
可以看到,在数据包的发送过程中,各层依次对数据包添加了首部信息,每个首部都包含发送端和接收端地址以及上一层的协议类型。以太网会使用 MAC 地址、IP 会使用 IP 地址、TCP/UDP 则会用端口号作为识别两端主机的地址。
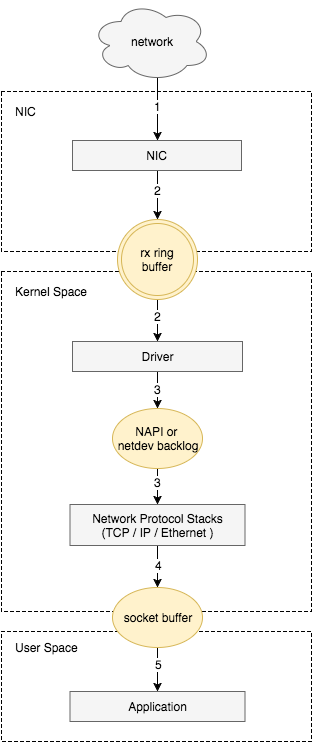
从宏观角度看收包过程:
- 网络报文通过物理网线发送到网卡
- 网络驱动程序会把网络中的报文读出来放到 ring buffer 中,这个过程使用 DMA 将数据包映射到内存
- 内核从 ring buffer 中读取报文进行处理,执行 IP 层和 TCP/UDP 层的逻辑,最后把报文放到应用程序的 socket buffer 中
- 应用程序从 socket buffer 中读取报文进行处理
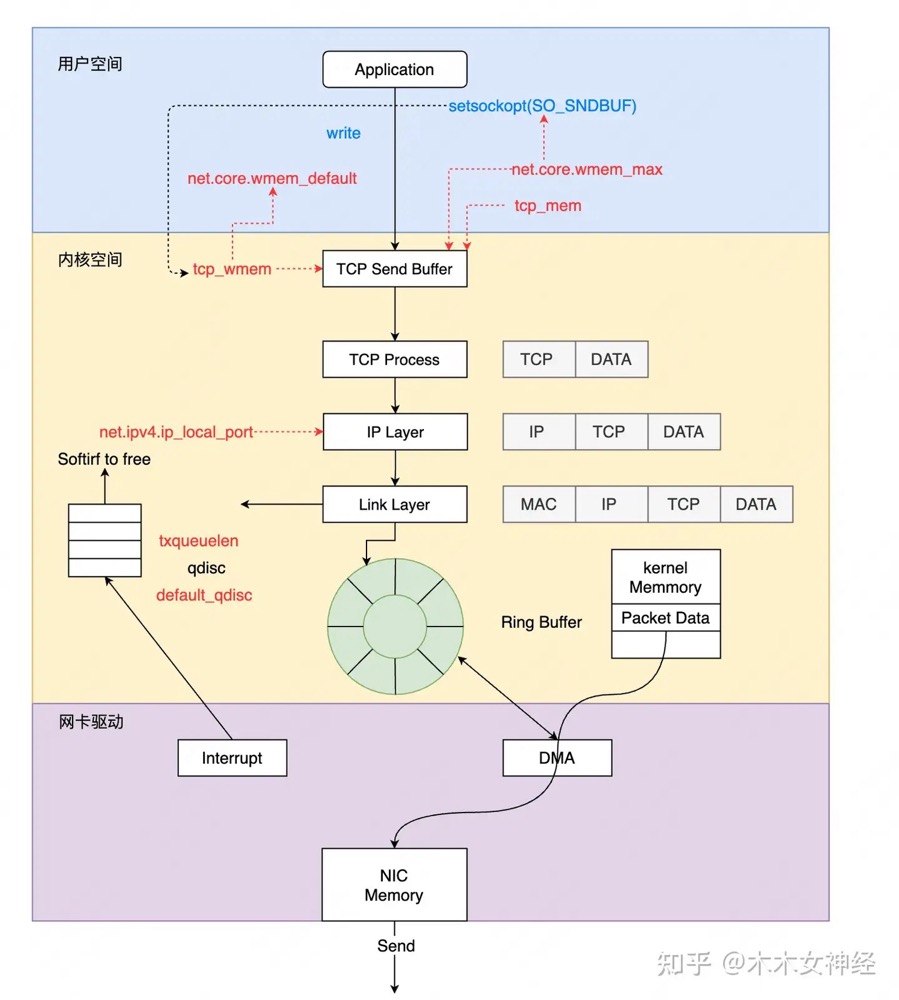
发送
https://zhuanlan.zhihu.com/p/619826703
接收
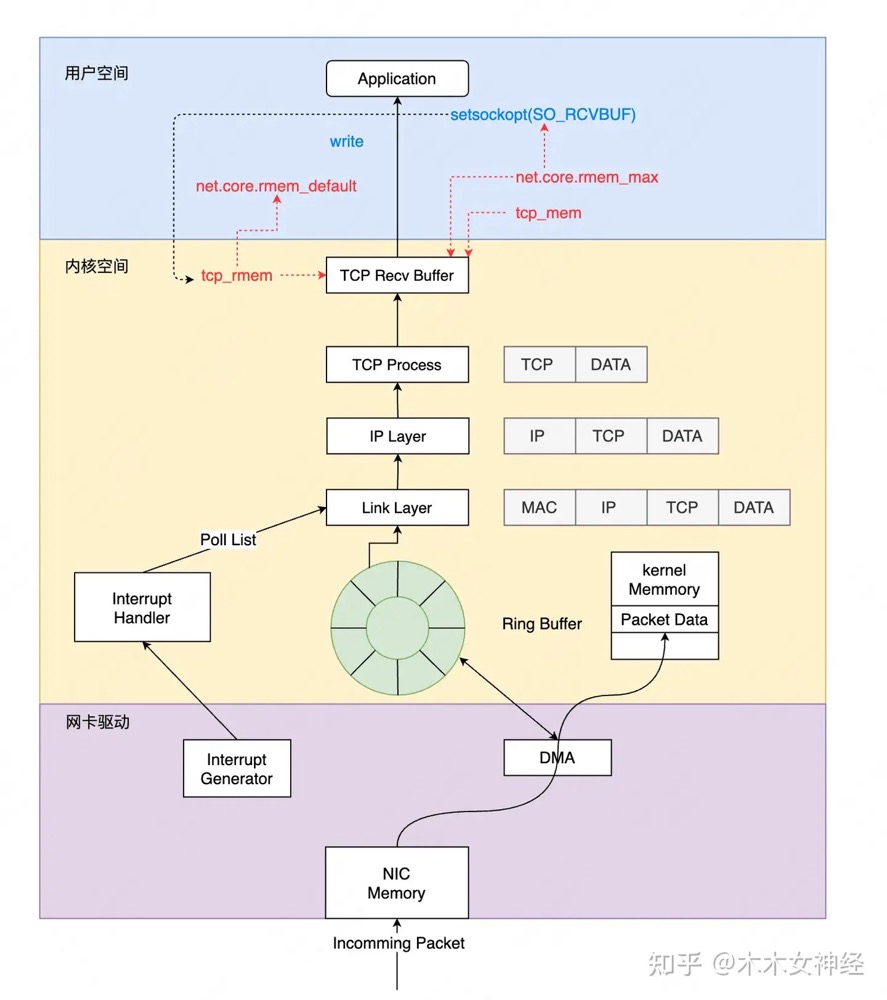
因此丢包会涉及到⽹卡、驱动、内核协议栈三⼤类,每一层都有可能会丢包:
- 在两台 VM 连接之间,可能会发生传输失败的错误,比如网络拥塞、线路错误等;
- 在网卡收包后,环形缓冲区可能会因为溢出而丢包;
- 在 IP 层,可能会因为路由失败、组包大小超过 MTU 等而丢包;
- 在传输层,可能会因为端口未监听、资源占用超过内核限制等而丢包;
- 在套接字层,可能会因为套接字缓冲区溢出而丢包;
- 在应用层,可能会因为应用程序异常而丢包;
推荐阅读下飞哥的图解 Linux 网络包发送过程
在 Linux 内核实现中,链路层协议靠网卡驱动来实现,内核协议栈来实现网络层和传输层。内核对更上层的应用层提供 socket 接口来供用户进程访问。
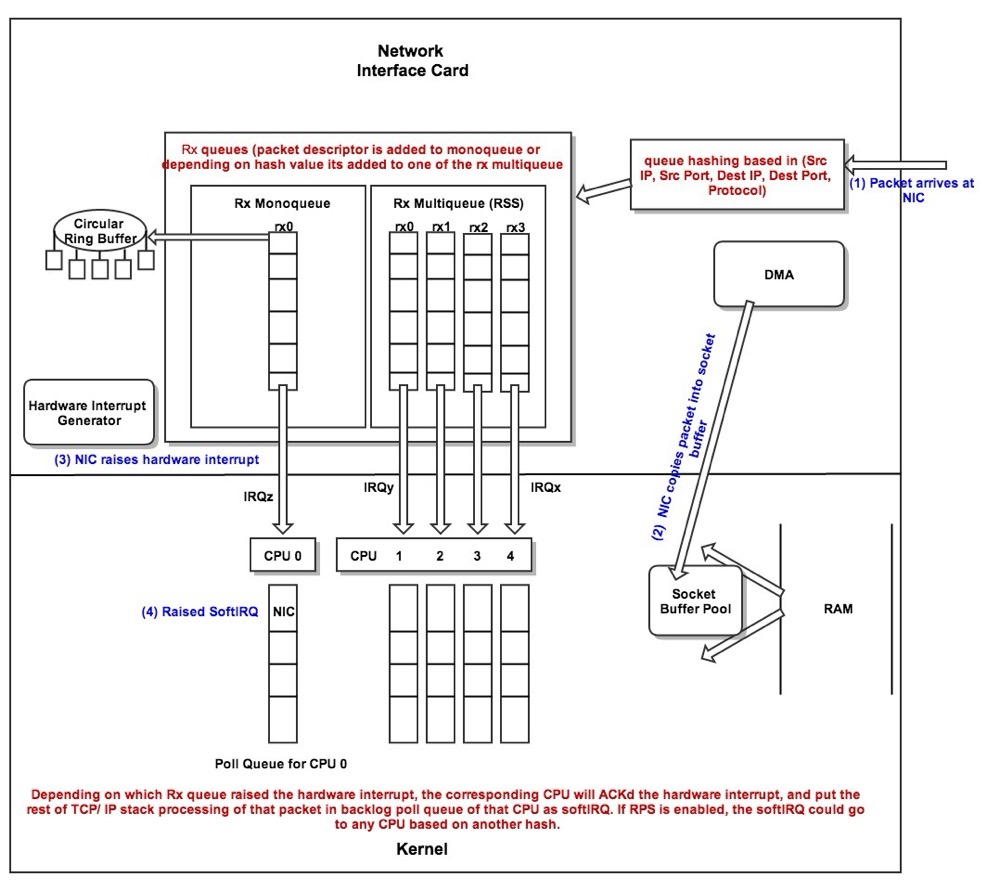
硬件网卡层
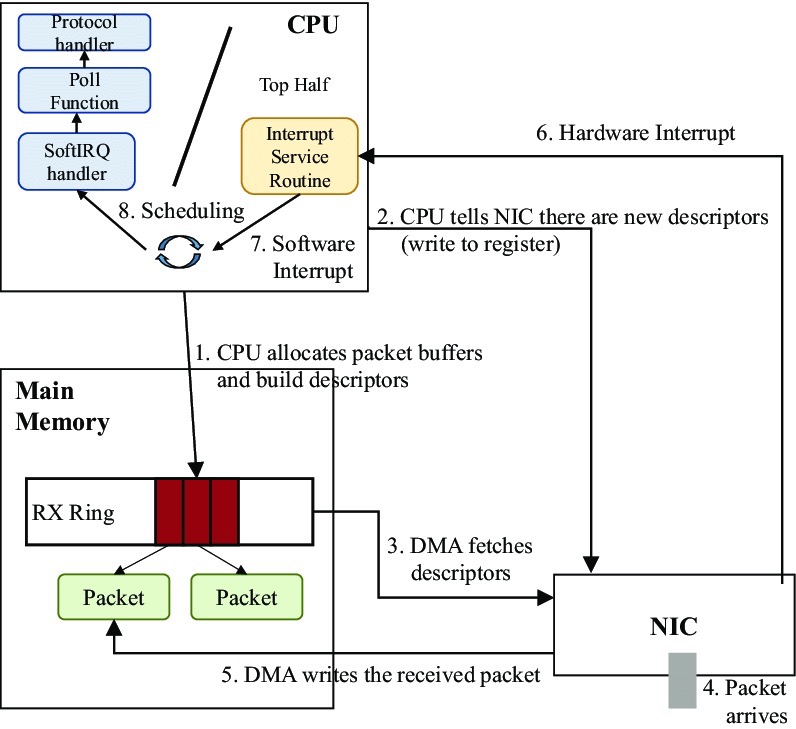
物理介质上的数据帧到达后首先由 NIC 读取,写入设备内部缓冲区 Ring Buffer 中,再由中断处理程序触发 Softirq 从中消费,Ring Buffer 的大小因网卡设备而异。当网络数据包到达 (生产) 的速率快于内核处理 (消费) 的速率时,Ring Buffer 很快会被填满,新来的数据包将被丢弃;
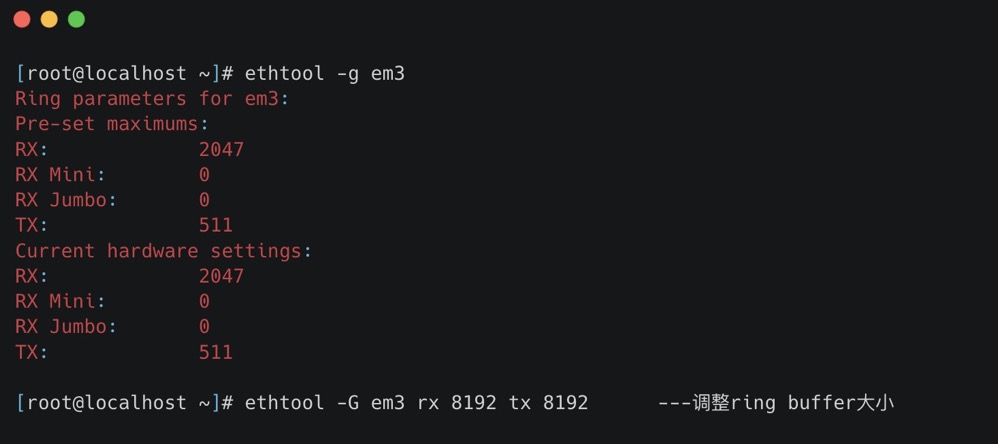
我们可以通过 ethtool、netstat 或者 cat /proc/net/dev 查看因 Ring Buffer 满而丢弃的包统计
ring buffer 的大小我们可以通过 ethtool 进行查看以及修改
-g:Display the rx/tx ring parameter information of the specified ethernet card。-G:change the rx/tx ring setting of the specified ethernet card。
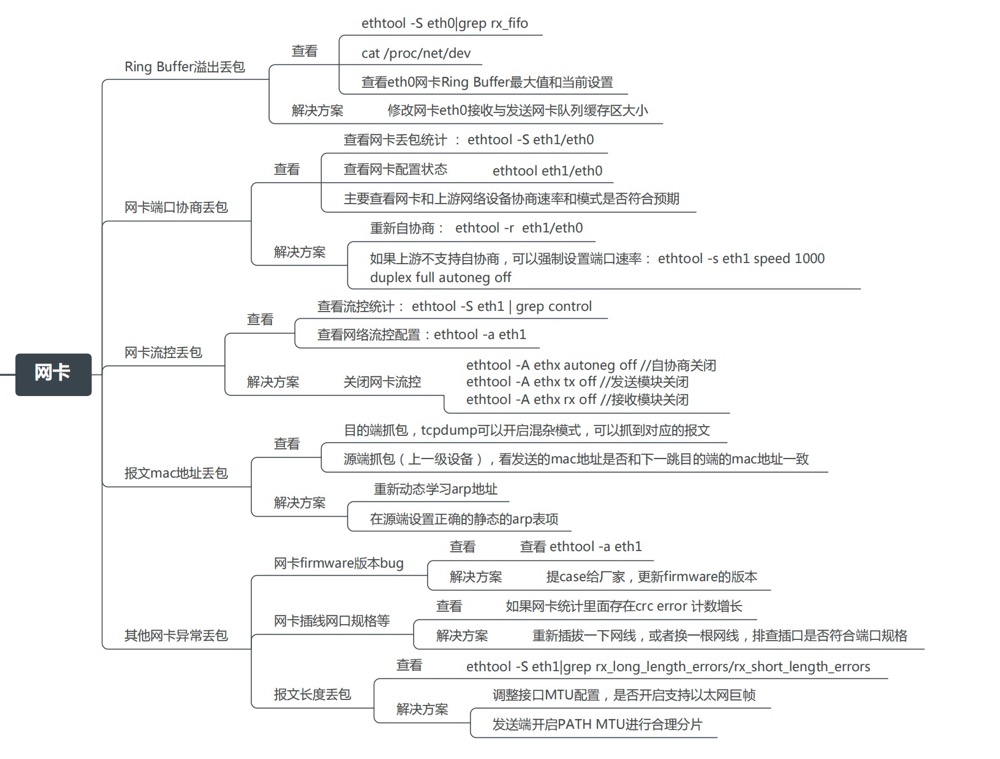
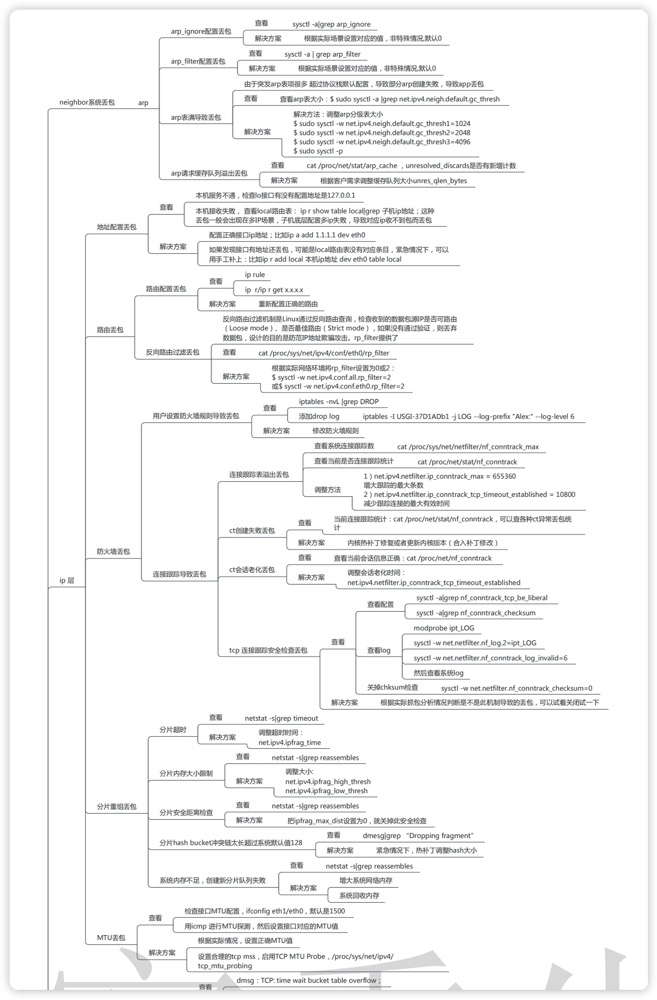
思维导图 (From Alex——网络排障全景指南v1.0精简版)
驱动层
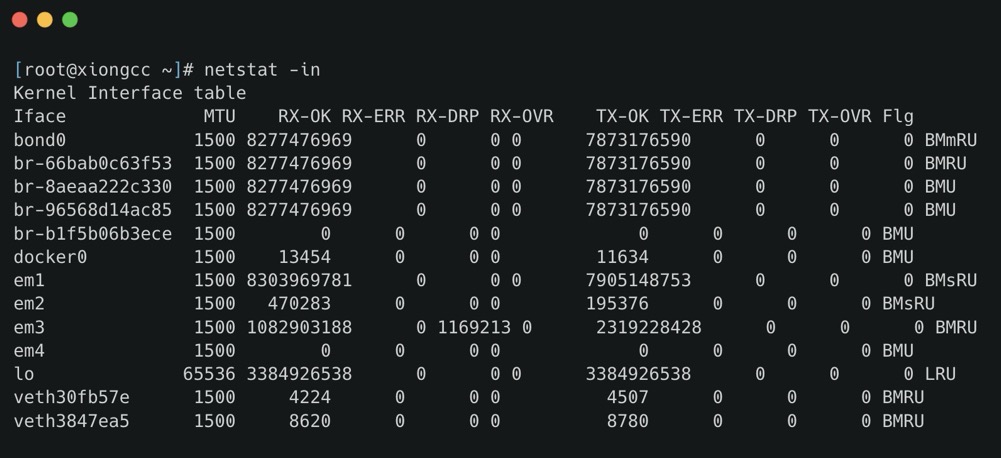
我们可以使用 ifconfig 查看
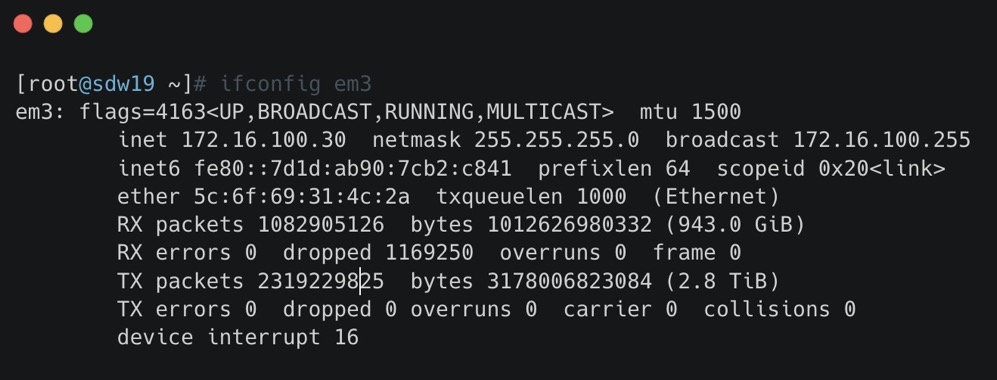
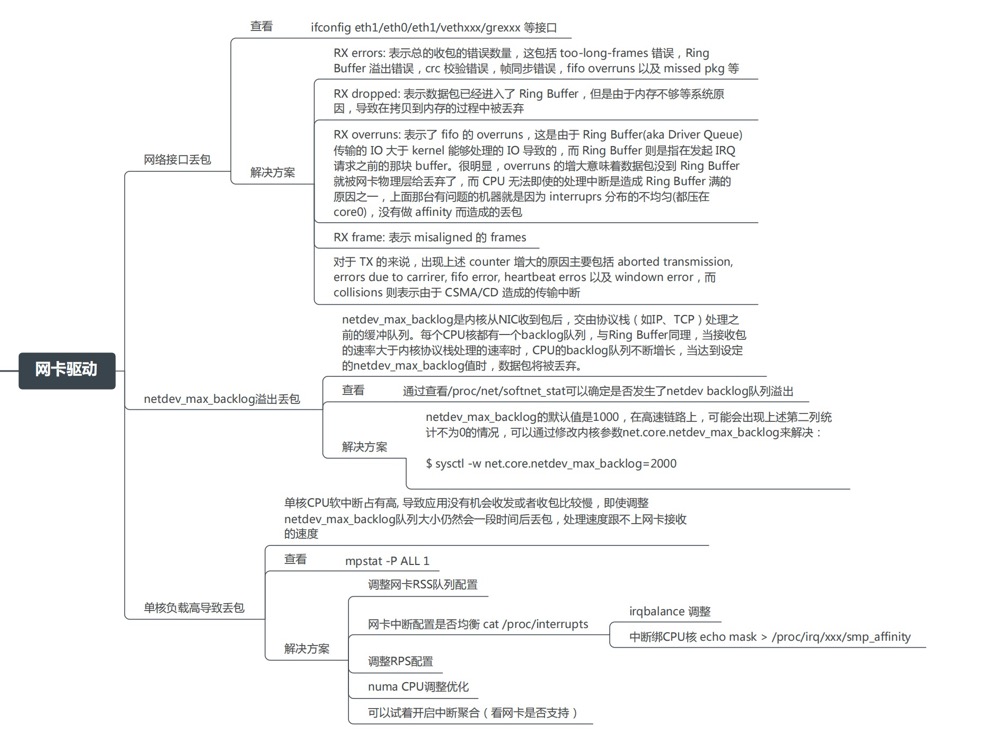
- RX-ERROR:表示总的收包的错误数量,这包括 too-long-frames 错误,Ring Buffer 溢出错误,crc 校验错误,帧同步错误,fifo overruns 以及 missed pkg 等等。
- RX-DROP:表示数据包已经进入了 Ring Buffer,但是由于内存不够等系统原因,导致在拷贝到内存的过程中被丢弃。
- RX overruns:表示了 fifo 的 overruns,这是由于 Ring Buffer(aka Driver Queue) 传输的 IO 大于 kernel 能够处理的 IO 导致的,而 Ring Buffer 则是指在发起 IRQ 请求之前的那块 buffer。很明显,overruns 的增大意味着数据包没到 Ring Buffer 就被网卡物理层给丢弃了,而 CPU 无法及时的处理中断是造成 Ring Buffer 满的原因之一
- RX frame: 表示 misaligned 的 frames。
dropped 与 overruns 的区别
dropped:表示这个数据包已经进入到网卡的接收缓存 fifo 队列,并且开始被系统中断处理准备进行数据包拷贝 (从网卡缓存 fifo 队列拷贝到系统内存),但由于此时的系统原因 (比如内存不够等) 导致这个数据包被丢掉,即这个数据包被 Linux 系统丢掉。
overruns:表示这个数据包还没有被进入到网卡的接收缓存 fifo 队列就被丢掉,因此此时网卡的 fifo 是满的。为什么 fifo 会是满的?因为系统繁忙,来不及响应网卡中断,导致网卡里的数据包没有及时的拷贝到系统内存,fifo 是满的就导致后面的数据包进不来,即这个数据包被网卡硬件丢掉。所以,个人觉得遇到 overruns 非 0,需要检测 CPU 负载与 CPU 中断情况
至于 TX 相关的类似,指发送时对应的各个指标。
另外一个常见原因是单核 CPU 软中断占有高,导致应用没有机会收发或者收包比较慢,我们可以使用 ethtool -x 查看,这些指标显示了接口如何处理入站网络流量,通过散列函数和转向表来分配到不同的接收环,从而实现在多处理器系统中的负载均衡。
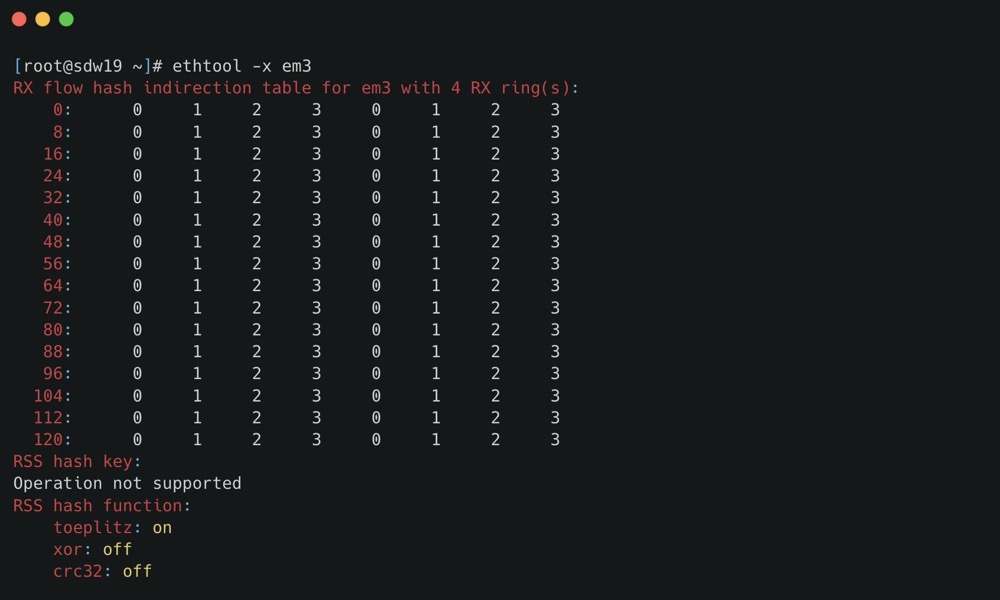
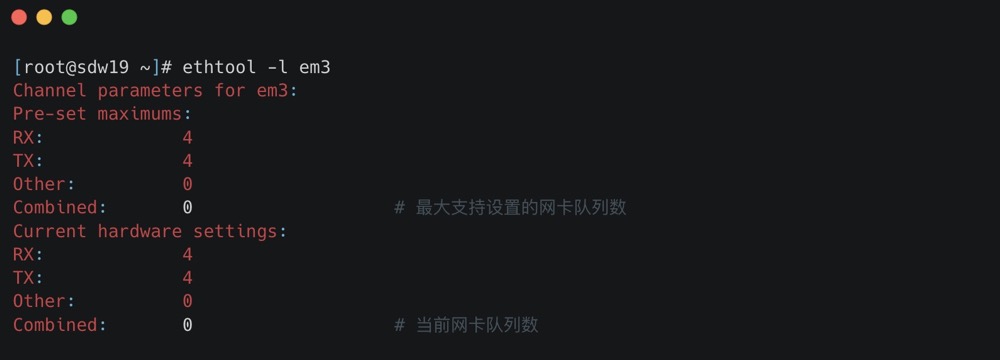
这里要提一下网卡多队列 RSS (Receive Side Scaling) 是网卡的硬件特性 (需要硬件支持),实现了多队列,多队列是 RX/TX 多个通路,分别负责各种的中断,可以将不同的流分发到不同的CPU上;
我们可以使用 ethtool -l 查看支持的队列数,以及 ethtool -L eth0 combined 4 修改队列数
配置了之后,我们可以使用 cat /proc/interrupts 查看当前是否已经开启了网卡多队列,通过查看网卡的中断集中分布在哪些 CPU 上,如果分布在多个 CPU 上,则当前已经开启了网卡多队列。以及通过绑核的方式将中断绑定到具体的 CPU 上
1 | echo "1" > /proc/irq/31/smp_affinity |
当然也可以通过 irqbalance,irqbalance 避免所有的 IRQ 请求都由单一的 CPU 负担,从而将硬件中断分布到多处理器系统的各个处理器以便能够提高性能,安装方式为:yum -y install irqbalance;
思维导图 (From Alex——网络排障全景指南v1.0精简版)
网络层
网络层我们可以使用 netstat -s 进行过滤
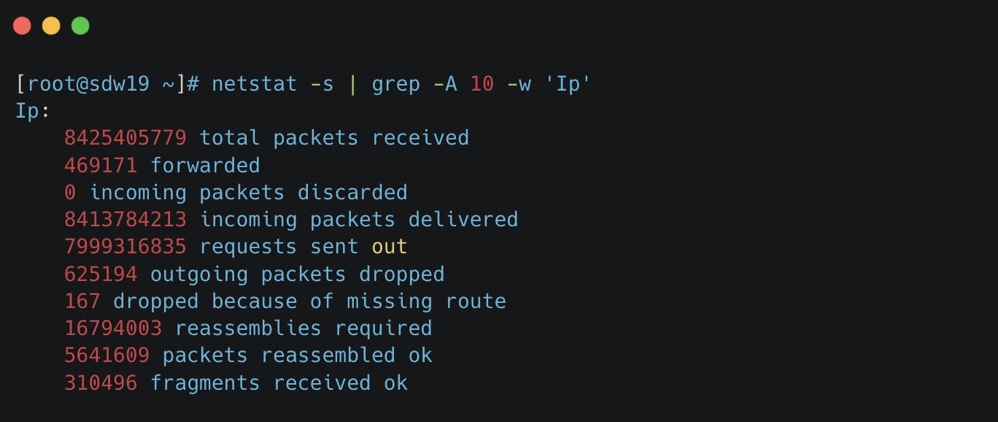
- total packets received: The total number of packets received by the interface. 接口接收到的数据包总数。
- forwarded: The number of packets that were forwarded to another interface. 被转发到另一个接口的数据包数量。
- incoming packets discarded: The number of incoming packets that were chosen not to be processed (discarded). 选择不处理(丢弃)的传入数据包数量。
- incoming packets delivered: The number of packets that were successfully delivered to the local higher layers. 成功交付给本地高层的数据包数量。
- requests sent out: The number of requests sent from the local host. 从本地主机发送出去的请求数量。
- outgoing packets dropped: The number of outgoing packets that were dropped and not sent. 被丢弃未发送的传出数据包数量。
- dropped because of missing route: The number of packets dropped because there was no route found to their destination. 因为没有找到目的地的路由而被丢弃的数据包数量。
- reassemblies required: The number of packets that needed to be reassembled from fragments. 需要从碎片中重组的数据包数量。
- packets reassembled ok: The number of packets that were successfully reassembled. 成功重组的数据包数量。
- fragments received ok: The number of fragment packets that were successfully received. 成功接收的碎片包数量。
ICMP 也是类似,此处就不再演示了。
另外一类可能的原因就是防火墙了, iptables -nvL |grep DROP ;
思维导图 (From Alex——网络排障全景指南v1.0精简版)
传输层
传输层协议包括 TCP 和 UDP,也可以使用 netstat 查看
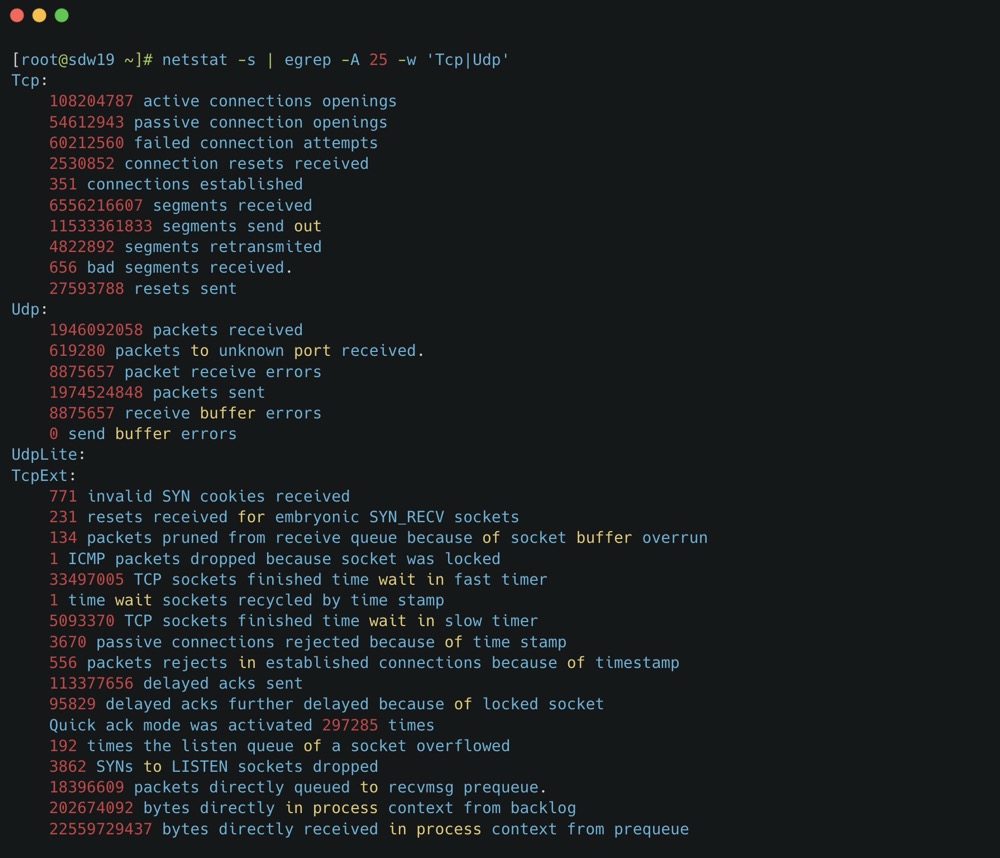
可以看到 retransmitted 就是 TCP 重传次数,bad 就是错误报文数,这个结果告诉我们 TCP 协议有多次重传。至于下方的 TcpExt,各个指标就不细展开了,可以询问 GPT。
另外需要提及的是 TIME_WAIT 过多丢包,大量 TIME_WAIT 出现,并且需要解决的场景,在高并发短连接的 TCP 服务器上,当服务器处理完请求后立刻按照主动正常关闭连接。这个场景下,会出现大量 socket 处于 TIMEWAIT 状态。如果客户端的并发量持续很高,此时部分客户端就会显示连接不上,新建立 TCP 连接会出错,address already in use : connect 异常
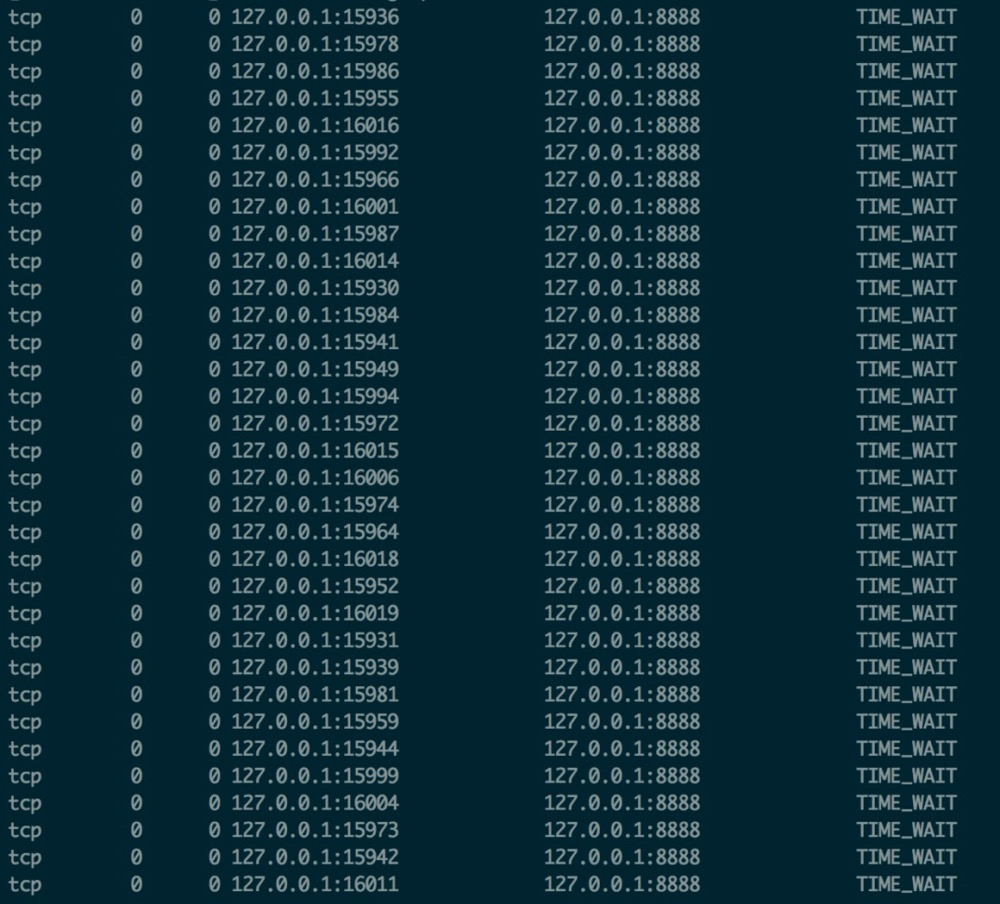
我们可以调整允许 time_wait 状态的 socket 被重用,tw_reuse,tw_recycle ,以及内存足够的话调整 tcp_max_tw_buckets 大小。
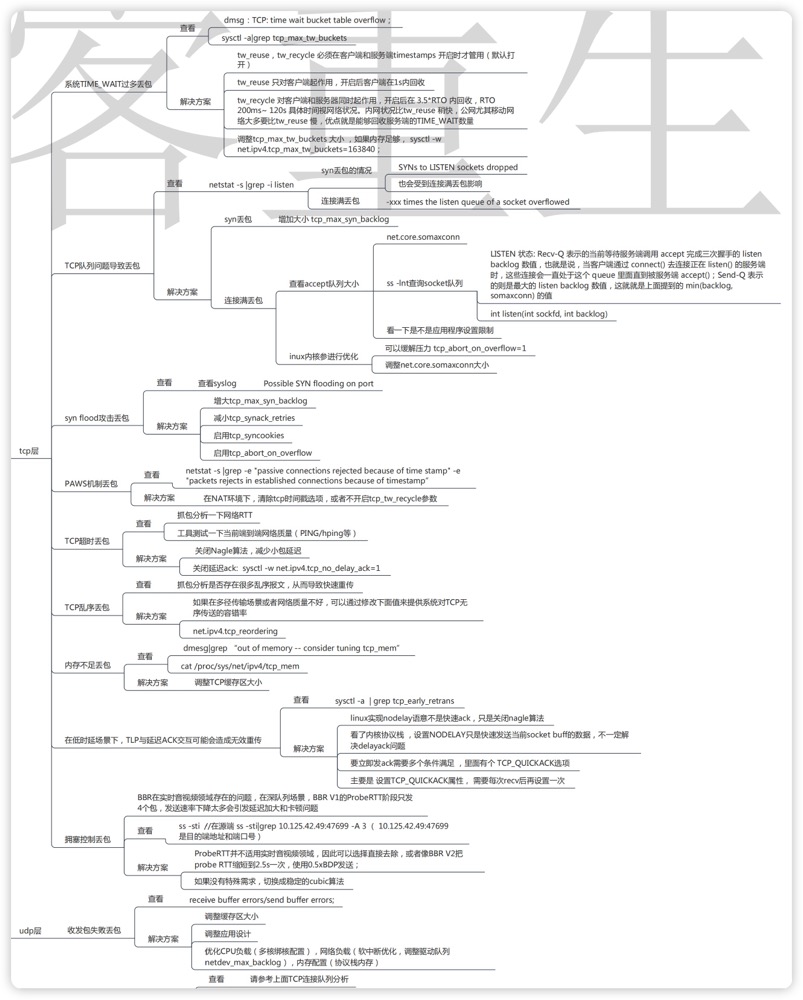
思维导图 (From Alex——网络排障全景指南v1.0精简版)
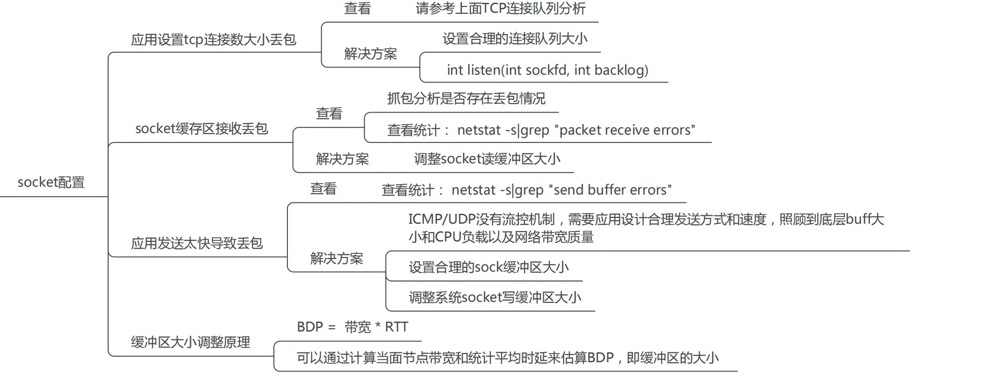
套接字
1 | [root@localhost ~]# netstat -s|grep "packet receive errors" |
可以看到有大量的 socket 缓存区接收丢包,我们可以调整 socket 缓冲区大小
1 | Default Socket Receive Buffer |
类似的还有应用发送太快导致丢包,以类似方式优化。
1 | [root@localhost ~]# netstat -s|grep "send buffer errors |
思维导图 (From Alex——网络排障全景指南v1.0精简版)
实用工具
除了前文提到的 ethtool、netstat 之类的命令,还推荐一个命令— sar
- -n DEV:网络接口统计信息。
- -n EDEV:网络接口错误。
- -n IP:IP 数据报统计信息。
- -n EIP:IP 错误统计信息。
- -n TCP:TCP 统计信息。
- -n ETCP:TCP 错误统计信息。
- -n SOCK:套接字使用。
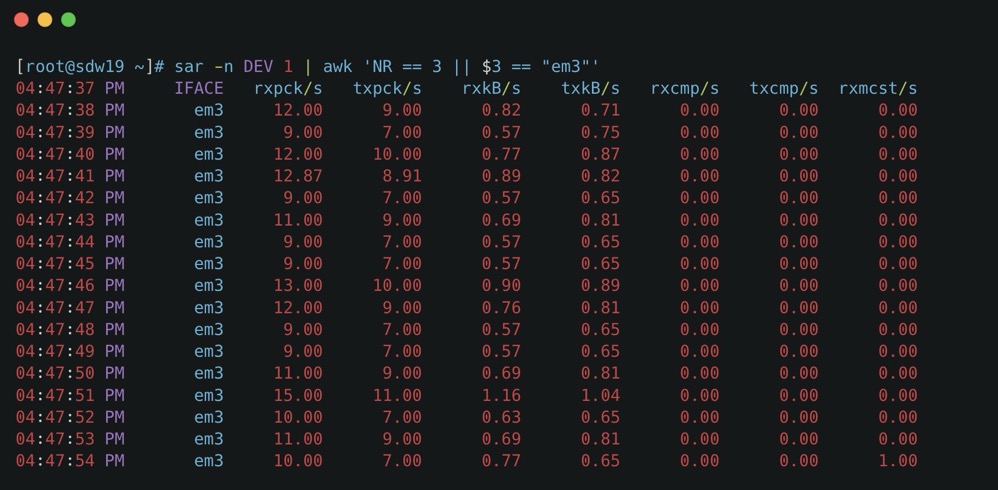
看个例子,比如 sar -n DEV 1 | awk ‘NR == 3 || $3 == “eth0”‘ 只分析 eth0

- rxpck/s / txpck/s:网卡接收/发送的数据包,单位是:数据包/s。
- rxkB/s / txkB/s:网卡接收/发送的千字节,单位是:千字节/s。
- rxcmp/s / txcmp/s:网卡每秒接受/发送的压缩数据包,单位是:数据包/s。
- rxmcst/s:每秒接收的多播数据包,单位是:数据包/s。
- %ifutil:网络接口的利用率。
- rxerr/s / txerr/s:每秒钟接收/发送的坏数据包
- coll/s:每秒冲突数
- rxdrop/s:因为缓冲充满,每秒钟丢弃的已接收数据包数
- txdrop/s:因为缓冲充满,每秒钟丢弃的已发送数据包数
- txcarr/s:发送数据包时,每秒载波错误数
- rxfram/s:每秒接收数据包的帧对齐错误数
- rxfifo/s / txfifo/s:接收/发送的数据包每秒 FIFO 过速的错误数
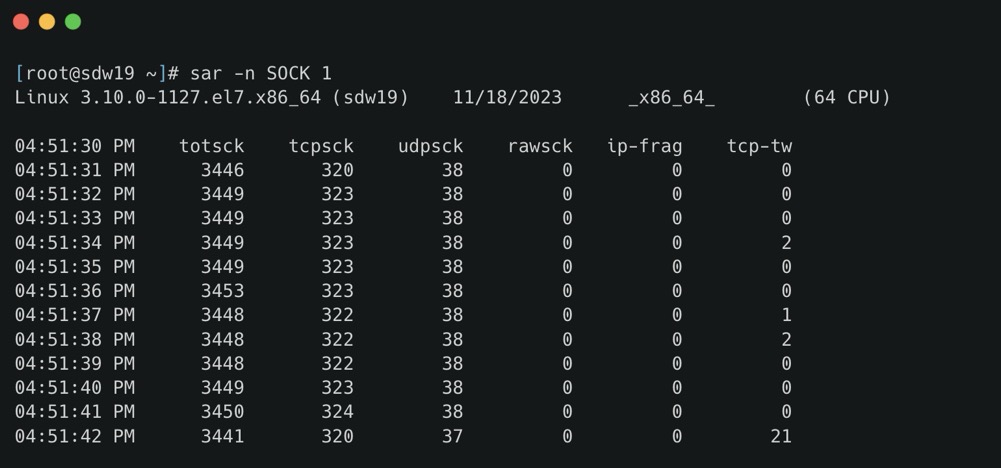
- totsck 当前被使用的 socket 总数
- tcpsck 当前正在被使用的 TCP 的 socket 总数
- udpsck 当前正在被使用的 UDP 的 socket 总数
- rawsck 当前正在被使用于 RAW 的 skcket 总数
- ip-frag 当前的 IP 分片的数目
- tcp-tw TCP 套接字中处于 TIME-WAIT 状态的连接数量
sar -n EIP 1 与 netstat -s | head -n 15 搭配分析 IP 重组失败
实际案例
TCP 重传
1 | [mxadmin@master ~]$ nstat -a | grep -i Segs |
IP分片
https://fasionchan.com/network/ip/fragmentation/
- 编写 UDP 应用,要严格控制数据报长度,不能超过链路最小 MTU ;
- 编写 TCP 应用,也要关注本地 MTU 设置,不然可能因中间路由分片导致通信失败;
1 | nstat -az | grep -e IpReasmFails -e IpReasmTimeout |
fragments dropped after timeout
1 | [mxadmin@mdw ~]$ gpssh -f allhosts -e 'netstat -s | grep dropped' |
fragments dropped after timeout 场景:IP 某个分片丢失,始终无法重组成一个完整的报文,在 reassemble buffer 中的其他分片就会一直滞留,直到 timeout 被丢弃,当系统中有大量的 fragments dropped after timeout 计数的增长时,我们一般需要确认的是底层链路是否存在一定的丢包率。
对于 Greenplum,可以通过调整 gp_max_packet_size 小于 1500,不要分包,但是牺牲的性能。
https://blog.51cto.com/feishujun/5523358
https://blog.csdn.net/wuyan6293/article/details/82191675
https://blog.csdn.net/weixin_42788640/article/details/120226226
ethtool -s
1 | [mxadmin@sdw19 ~]$ ethtool -S em3 |
常见的指标包括:
- rx_packets / tx_packets:接收和发送的数据包总数。
- rx_bytes / tx_bytes:接收和发送的字节总数。
- rx_errors / tx_errors:接收和发送过程中发生的错误总数。
- rx_dropped / tx_dropped:因各种原因(如缓冲区溢出、硬件错误)被丢弃的接收和发送数据包数量。
- multicast:接收到的多播数据包数量。
- collisions:网络冲突次数,通常在半双工模式下出现。
- rx_crc_errors:接收时发生的循环冗余校验(CRC)错误数量,可能表示数据包在传输过程中被损坏。
- rx_frame_errors:帧错误数量,通常由于帧长度不正确或不匹配导致。
- rx_fifo_errors / tx_fifo_errors:接收和发送时的 FIFO 溢出错误数量,表示数据包在处理过程中被丢弃。
- rx_length_errors:接收到的具有不正确长度的数据包数量。
- rx_over_errors:接收时发生的缓冲区溢出错误数量。
- tx_aborted_errors:发送过程中被中止的帧数量。
- tx_carrier_errors:由于载波信号问题导致的发送错误数量。
- tx_window_errors:由于窗口大小问题导致的发送错误数量。
- rx_missed_errors:由于硬件无法及时处理而错过的接收数据包数量。
注意事项:
- 驱动和硬件相关性:
ethtool -S命令显示的指标可能因网卡的驱动程序和硬件不同而有所差异。某些高级网卡或特殊驱动程序可能提供额外的统计信息,如硬件卸载特性、队列状态等。 - 指标解释:了解每个指标的含义有助于定位网络问题。例如,高数量的
rx_crc_errors可能表示线路质量问题,而tx_fifo_errors可能与发送缓冲区配置有关。
如何使用这些指标:
- 诊断网络问题:通过分析错误和丢包统计,可以识别物理层或数据链路层的问题,如线缆故障、接口配置不匹配等。
- 性能监控:监控数据包和字节的传输量,有助于了解网络流量模式,进行容量规划和性能优化。
- 硬件故障检测:持续增加的错误计数可能预示着网卡硬件故障,需要及时更换或维护。
小结
以上就是关于网络丢包的一点总结,参考了大量的文章,好记性不如烂笔头,将碎片化的知识形成体系,感谢巨人的肩膀 Alex 荣哥。
下一篇总结一下网络性能优化。
参考
网络排障全景指南v1.0精简版
Linux性能优化实战-47案例篇:服务器总是时不时丢包,我该怎么办?(上)