
CPU冲高分析方法
应用层
慢 SQL
一般慢SQL是导致CPU冲高的主要原因,常见的慢SQL原因有:
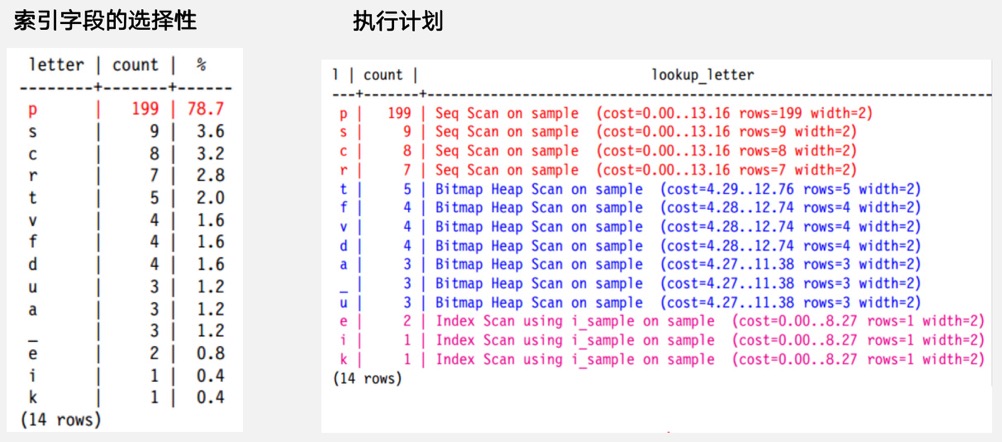
缺失有效索引,使用了顺序扫描:查看数据库运行日志,找到高消耗的SQL(duration运行时间长的)以及相应的执行计划(auto_explain会将超过指定时间的慢SQL执行计划记录在日志中),查看执行计划中顺序扫描(seq scan)的部分,观察过滤条件(filter)的选择率,高选择率的列可以建立合适的索引
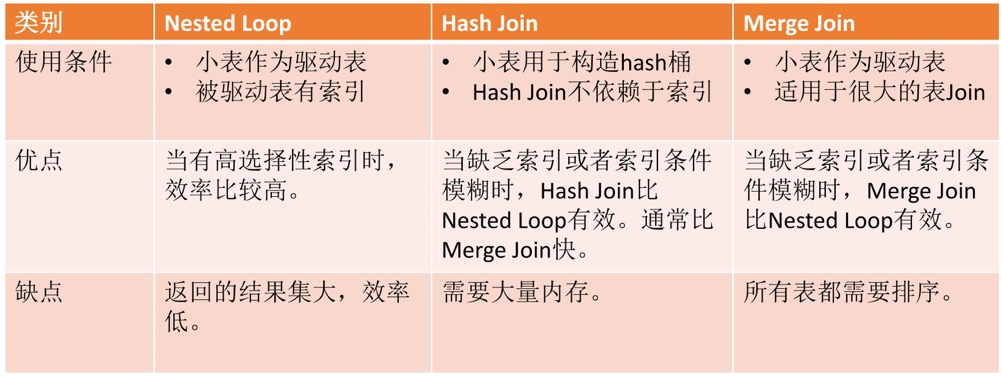
nestloop的消耗相对较高,其复杂度表示为:O(Ra * Rb),被驱动表在有索引的情况下效率高,可以在AWR中查看高消耗的SQL以及nestloop部分,日志中查看执行计划
缺失统计信息,导致优化器使用默认选择率:典型场景是修改了列的长度或者修改了列的类型,会导致该列的统计信息丢失,选择默认选择率,因此做了如上操作之后需要手动收集该表的统计信息
1
2
3
4
5
6
7
8
9
10
11
12
13
14
15
16
17
18
19
20
21
22
23
24
25
26
27
28
29
30
31
32
33
34postgres=# create table t(id int,info varchar(10));
CREATE TABLE
postgres=# create index on t(info);
CREATE INDEX
postgres=# insert into t select n,left(md5(random()::text),10) from generate_series(1,100000) as n;
INSERT 0 100000
postgres=# analyze t;
ANALYZE
postgres=# explain select id,info from t where info = 'hello';
QUERY PLAN
---------------------------------------------------------------------
Index Scan using t_info_idx on t (cost=0.42..8.44 rows=1 width=15)
Index Cond: ((info)::text = 'hello'::text)
(2 rows)
postgres=# alter table t alter COLUMN info type varchar(20); ---会导致info列的统计信息丢失
ALTER TABLE
postgres=# explain select id,info from t where info = 'hello'; ---使用了默认选择率
QUERY PLAN
----------------------------------------------------------------------------
Bitmap Heap Scan on t (cost=16.29..574.78 rows=500 width=62)
Recheck Cond: ((info)::text = 'hello'::text)
-> Bitmap Index Scan on t_info_idx (cost=0.00..16.17 rows=500 width=0)
Index Cond: ((info)::text = 'hello'::text)
(4 rows)
postgres=# analyze t;
ANALYZE
postgres=# explain select id,info from t where info = 'hello'; ---选择了正确的执行计划
QUERY PLAN
---------------------------------------------------------------------
Index Scan using t_info_idx on t (cost=0.42..8.44 rows=1 width=15)
Index Cond: ((info)::text = 'hello'::text)
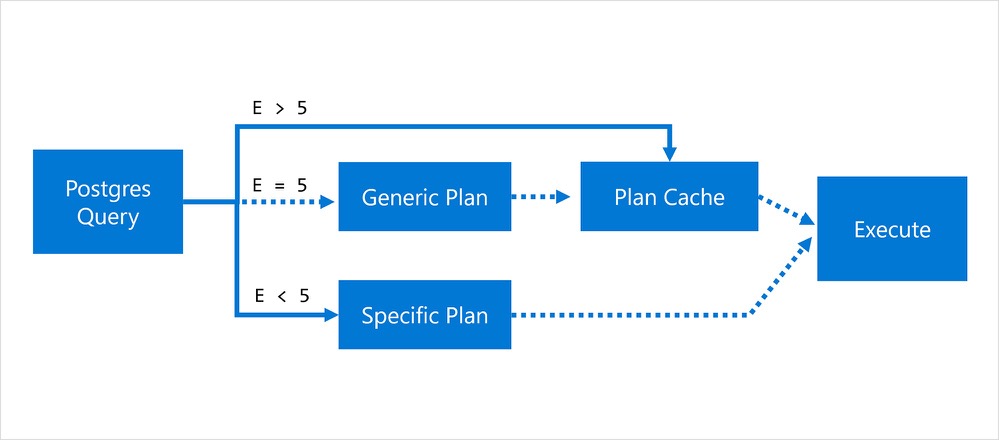
(2 rows)绑定变量,默认情况下数据库会在5次解析之后可能复用前面的执行计划(优化器会自行判断是否选择软解析),但是有可能会导致SQL选择错误的执行计划,可以在JDBC中配置prepareThreshold=0(preparedStatementCacheQueries也可以,客户端限制每个连接缓存的预编译语句数量)或者将数据库参数配置为plan_cache_mode=force_custom_plan,这样就会永远走硬解析
对于复杂类的 SQL,由于一些代码框架的问题,你可能会在日志中看到很多诸如 $2 这种带有绑定变量的 SQL,假如要分析性能问题的话就比较头疼,不仅要去看表的定义,还要一个个代入绑定变量的值,因此一个可行的方式是:
- 使用 “unknown” 伪类型替代变量类型,让 PostgreSQL 自己去找合适的数据类型
- 输入 NULL 作为参数值
- 使用force_generic_plan生成一个通用执行计划
但是如果数据分布倾斜较大,这种方式就不适用了,不过聊胜于无。
元信息过多/系统表臃肿,不仅单个SQL慢,整个系统都慢,系统表的膨胀一般都是失效的逻辑复制槽导致
插件的影响,比如 pg_stat_statements 里面记录了上万个绑定变量,查询 pg_stat_statements 也会变慢,参照之前案例
统计信息陈旧,表中的数据量发生了改变,但是还没有达到数据库统计信息收集的触发阈值,导致使用了陈旧的统计信息生成了执行计划,可以查看pg_stat_all_tables中的last_analyze、last_autoanalyze字段是否距离当前时间过久,过久需要重新收集统计信息,针对大表需要调整 autovacuum_analyze_scale_factor/autovacuum_analyze_threshold触发阈值。评估vacuum何时触发
1
2
3
4
5
6
7
8
9
10
11
12
13
14
15
16
17
18
19
20
21
22
23
24
25
26
27
28
29
30
31
32
33
34
35
36
37
38
39
40
41
42
43
44
45
46
47
48
49
50
51=> CREATE FUNCTION p(param text, c pg_class) RETURNS float
AS $$
SELECT coalesce(
-- use storage parameter if set
(SELECT option_value
FROM pg_options_to_table(c.reloptions)
WHERE option_name = CASE
-- for TOAST tables the parameter name is different
WHEN c.relkind = 't' THEN 'toast.' ELSE ''
END || param
),
-- else take the configuration parameter value
current_setting(param)
)::float;
$$ LANGUAGE sql;
=> CREATE VIEW need_vacuum AS
WITH c AS (
SELECT c.oid,
greatest(c.reltuples, 0) reltuples,
p('autovacuum_vacuum_threshold', c) threshold,
p('autovacuum_vacuum_scale_factor', c) scale_factor,
p('autovacuum_vacuum_insert_threshold', c) ins_threshold,
p('autovacuum_vacuum_insert_scale_factor', c) ins_scale_factor
FROM pg_class c
WHERE c.relkind IN ('r','m','t')
)
SELECT st.schemaname || '.' || st.relname AS tablename,
st.n_dead_tup AS dead_tup,
c.threshold + c.scale_factor * c.reltuples AS max_dead_tup,
st.n_ins_since_vacuum AS ins_tup,
c.ins_threshold + c.ins_scale_factor * c.reltuples AS max_ins_tup,
st.last_autovacuum
FROM pg_stat_all_tables st
JOIN c ON c.oid = st.relid;
=> CREATE VIEW need_analyze AS
WITH c AS (
SELECT c.oid,
greatest(c.reltuples, 0) reltuples,
p('autovacuum_analyze_threshold', c) threshold,
p('autovacuum_analyze_scale_factor', c) scale_factor
FROM pg_class c
WHERE c.relkind IN ('r','m')
)
SELECT st.schemaname || '.' || st.relname AS tablename,
st.n_mod_since_analyze AS mod_tup,
c.threshold + c.scale_factor * c.reltuples AS max_mod_tup,
st.last_autoanalyze
FROM pg_stat_all_tables st
JOIN c ON c.oid = st.relid;写法优化,优化器无法理解实际的语义,需要手动配合修改
union all 的案例 PostgreSQL中UNION ALL的性能问题,https://www.techonthenet.com/postgresql/union_all.php,数据类型必须保持一致
1
2
3
4
5
/*
* We require all the setops to be UNION ALL (no mixing) and there can't be
* any datatype coercions involved, ie, all the leaf queries must emit the
* same datatypes.
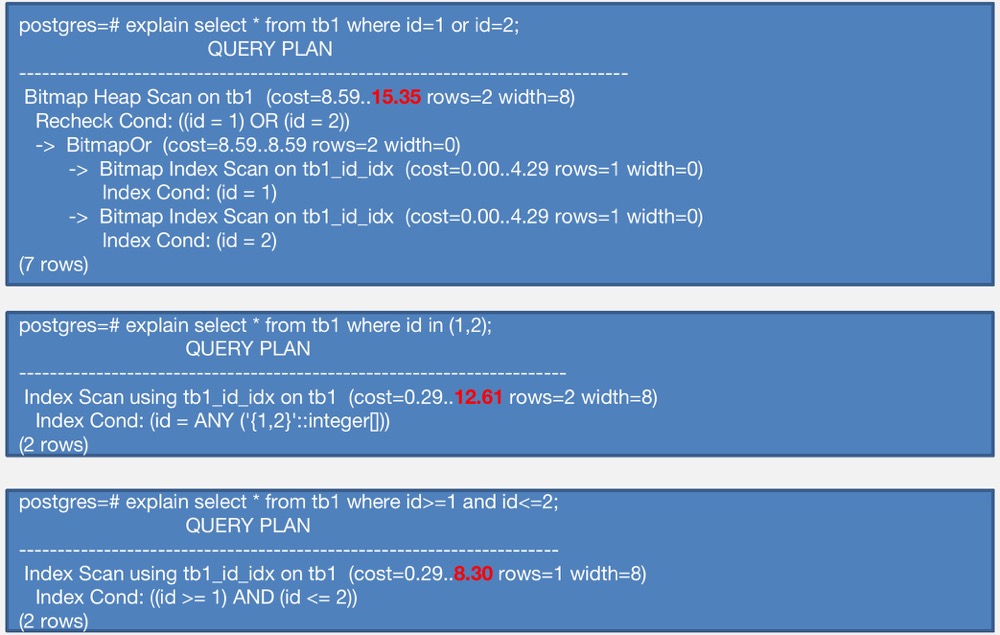
*/复合条件c1=xx and (c2=xx or c2=xx)写法的优化
1
2
3
4
5
6
7
8
9
10
11
12
13
14
15
16
17
18
19
20
21
22
23
24
25
26
27
28
29postgres=# create table td(id int, c1 int, c2 int, c3 int);
CREATE TABLE
postgres=# insert into td select generate_series(1,10000000), random()*100, random()*1000, random()*10000;
INSERT 0 10000000
postgres=# create index idx_td_1 on td(c1,c2);
CREATE INDEX
postgres=# explain select * from td where c1=1 and (c2=1 or c2=2);
QUERY PLAN
-------------------------------------------------------------------------------
Bitmap Heap Scan on td (cost=8.32..560.09 rows=499 width=16)
Recheck Cond: (((c1 = 1) AND (c2 = 1)) OR ((c1 = 1) AND (c2 = 2)))
-> BitmapOr (cost=8.32..8.32 rows=500 width=0)
-> Bitmap Index Scan on idx_td_1 (cost=0.00..4.04 rows=250 width=0)
Index Cond: ((c1 = 1) AND (c2 = 1))
-> Bitmap Index Scan on idx_td_1 (cost=0.00..4.04 rows=250 width=0)
Index Cond: ((c1 = 1) AND (c2 = 2))
(7 rows)
postgres=# explain select * from td where c2=1 and (c1=1 or c1=2);
QUERY PLAN
-------------------------------------------------------------------------------
Bitmap Heap Scan on td (cost=5.17..226.34 rows=198 width=16)
Recheck Cond: (((c1 = 1) AND (c2 = 1)) OR ((c1 = 2) AND (c2 = 1)))
-> BitmapOr (cost=5.17..5.17 rows=199 width=0)
-> Bitmap Index Scan on idx_td_1 (cost=0.00..2.52 rows=99 width=0)
Index Cond: ((c1 = 1) AND (c2 = 1))
-> Bitmap Index Scan on idx_td_1 (cost=0.00..2.55 rows=101 width=0)
Index Cond: ((c1 = 2) AND (c2 = 1))
(7 rows)改写 SQL
1
2
3
4
5
6
7
8
9
10
11
12
13
14
15
16
17
18
19
20
21
22
23
24
25
26
27
28
29
30
31
32
33
34
35
36
37
38
39
40postgres=# explain select * from td where c2=1 and c1 in (1,2);
QUERY PLAN
------------------------------------------------------------------------
Index Scan using idx_td_1 on td (cost=0.43..225.96 rows=199 width=16)
Index Cond: ((c1 = ANY ('{1,2}'::integer[])) AND (c2 = 1))
(2 rows)
postgres=# explain select * from td where c2=1 and c1 = any(array [1,2]);
QUERY PLAN
------------------------------------------------------------------------
Index Scan using idx_td_1 on td (cost=0.43..225.96 rows=199 width=16)
Index Cond: ((c1 = ANY ('{1,2}'::integer[])) AND (c2 = 1))
(2 rows)
postgres=# explain select * from td where c1=1 and c2 = any(array [1,2]);
QUERY PLAN
------------------------------------------------------------------------
Index Scan using idx_td_1 on td (cost=0.43..224.83 rows=198 width=16)
Index Cond: ((c1 = 1) AND (c2 = ANY ('{1,2}'::integer[])))
(2 rows)
postgres=# explain (verbose,analyze,verbose,timing,costs) select * from td where c1=1 and c2 = any(array [1,2]);
QUERY PLAN
---------------------------------------------------------------------------------------------------------------------------
Index Scan using idx_td_1 on public.td (cost=0.43..224.83 rows=198 width=16) (actual time=0.104..0.556 rows=190 loops=1)
Output: id, c1, c2, c3
Index Cond: ((td.c1 = 1) AND (td.c2 = ANY ('{1,2}'::integer[])))
Planning Time: 0.141 ms
Execution Time: 0.583 ms
(5 rows)
postgres=# explain (verbose,analyze,verbose,timing,costs) select * from td where c2=1 and c1 = any(array [1,2]);
QUERY PLAN
---------------------------------------------------------------------------------------------------------------------------
Index Scan using idx_td_1 on public.td (cost=0.43..225.96 rows=199 width=16) (actual time=0.024..0.499 rows=184 loops=1)
Output: id, c1, c2, c3
Index Cond: ((td.c1 = ANY ('{1,2}'::integer[])) AND (td.c2 = 1))
Planning Time: 0.092 ms
Execution Time: 0.521 ms
(5 rows)索引失效,导致数据库只能选择顺序扫描
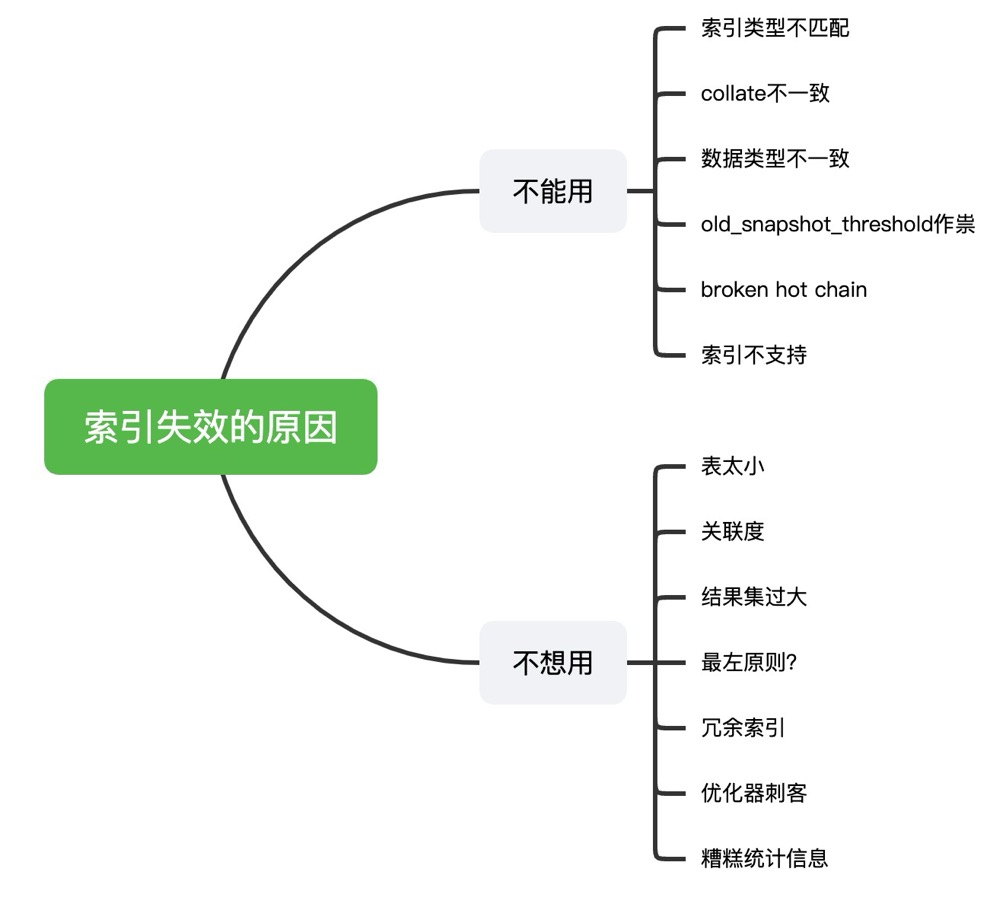
优化器参数,比如enable_seqscan=off,则数据库将”禁止”使用顺序扫描(给顺序扫描分配一个10亿的成本),而选择其他的扫描方式,但是如果没有合适的索引,那么优化器只能选择顺序扫描,会导致性能骤降,可以排查是否在客户端配置了优化器参数,数据库层面是否配置,用户层面是否配置
纯高消耗的SQL,实打实的计算量过多,比如 with recursive/过多子查询/需要大量中间结果集/函数计算/未使用裁剪等,高消耗的SQL可以配合PVE重点筛查高消耗的算子
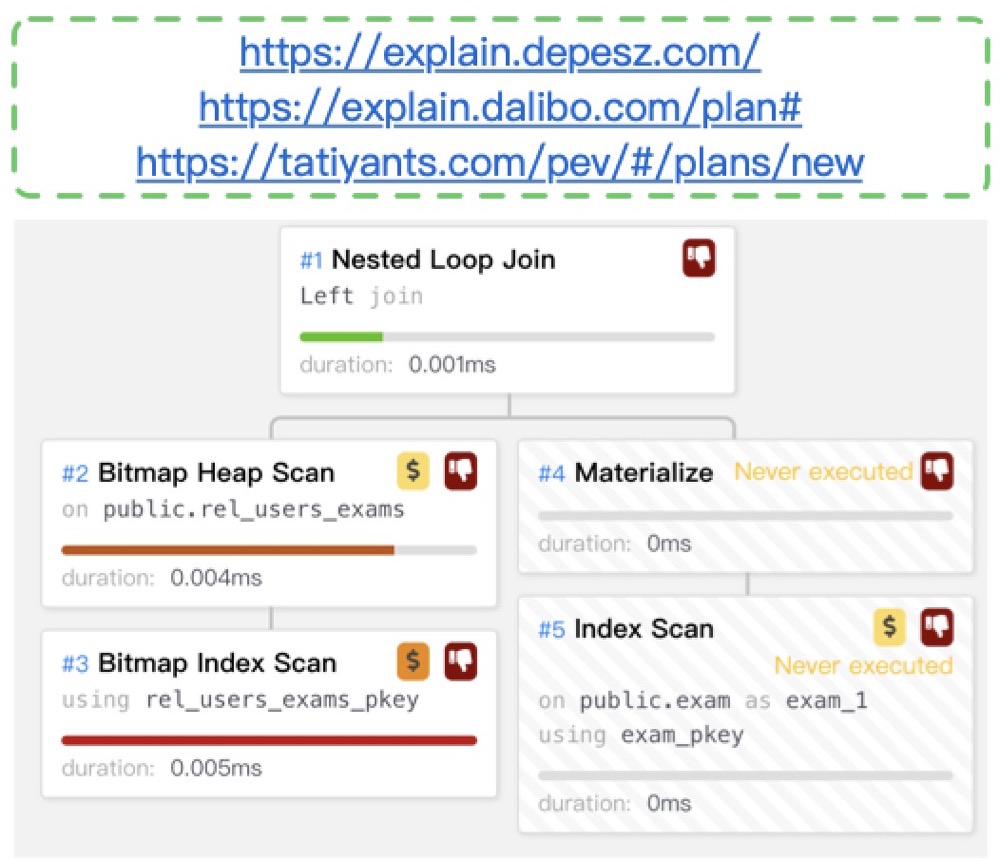
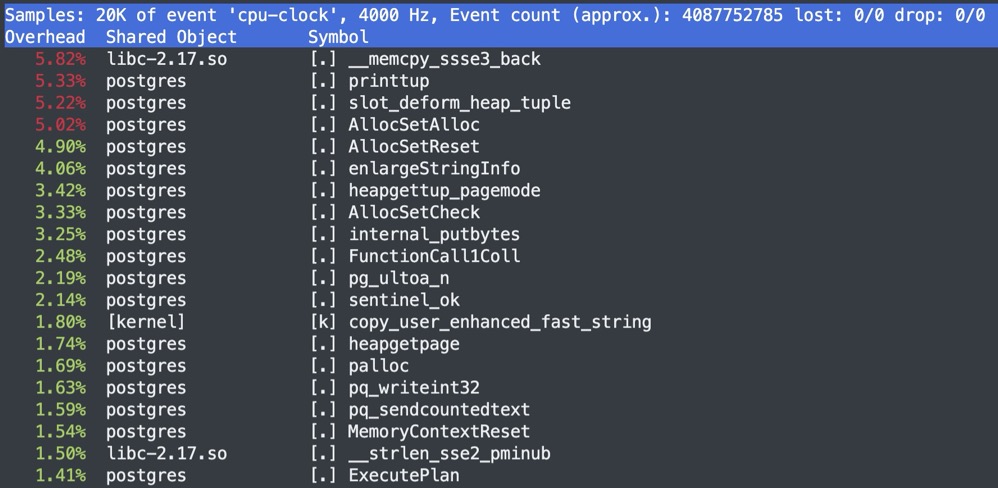
同时配合操作系统的perf/pstack/strace,找到CPU消耗的部分
perf top -p pid
perf stat -p pid,观察上下文
- task-clock(msec):指程序运行期间占用了多少任务时钟周期,该值高,说明程序的多数时间花费在 CPU 计算上而非 IO
- context-switches:指程序运行期间发生了多少次上下文切换,记录了程序运行过程中发生了多少次进程切换,频繁的进程切换是应该避免的(有进程进程间频繁切换,或者内核态与用户态频繁切换)
- cpu-migrations:指程序运行期间发生了多少次CPU迁移,即用户程序原本在一个CPU上运行,后来迁移到另一个CPU
- cycles:处理器时钟,一条机器指令可能需要多个cycles
- Instructions:机器指令数目。
- 其他可以监控的譬如分支预测、cache命中
- page-faults 是指程序发生了多少次缺页错误等
perf record + 火焰图
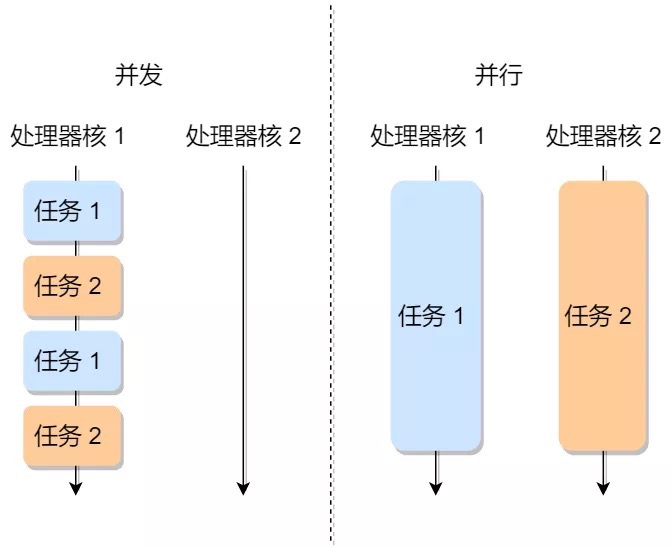
并发过高
并发是两个队列交替使用一台咖啡机,并行是两个队列同时使用两台咖啡机
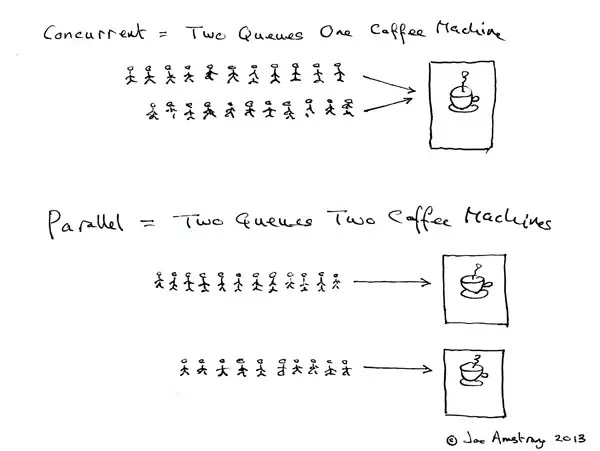
假如某个时刻涌入的SQL过多(并发过高),不仅会让操作系统在自身的进程调度上耗费更多资源,而且CPU资源也是有限的,一旦某一时刻并发涌入的SQL执行算力超过了总的CPU资源,就会导致CPU 100%,这一点很好理解。
可以使用 vmstat/pidstat 等命令观察上下文切换:
- 过多的上下文切换,会把CPU时间消耗在寄存器,内核栈以及虚拟内存等数据的保存和恢复上,从而缩短进程真正运行的时间,导致系统的整体性能大幅下降。
- 自愿上下文切换变多了,说明进程都在等待资源,有可能发生了 I/O 等其他问题
- 非自愿上下文切换变多了,说明进程都在被强制调度,也就是都在争抢 CPU,说明 CPU 的确成了瓶颈
- 中断次数变多了,说明 CPU 被中断处理程序占用,还需要通过查看 /proc/interrupts 文件来分析具体的中断类型。
另外数据库也是支持并行的,假如某个SQL使用了并行(执行计划中可以看到parallel相关算子),同时该SQL的并发又高,会导致这一类SQL互相之间争抢CPU资源,不仅导致系统消耗增加,还会导致这一类SQL的RT不稳定(抢到CPU的SQL使用并行,没抢到就无法使用并行,时间自然不是一个量级)可以将数据库参数max_parallel_workers_per_gather 设为0,同时全局的并行进行受限于 max_worker_processes 参数。
数据库层
自身消耗
数据库本身会做一些维护性的操作,比如vacuum/freeze等
数据库可能有很多大表的年龄会先后到达2亿,数据库的autovacuum会开始对这些表依次进行vacuum freeze,从而集中式的爆发大量的读写
假如表达到了vacuum的阈值,但是由于长事务/复制槽/2pc/游标等持有xmin或xid的对象会使表无法清理(只能降低到长事务,降低清理的效率),某些情况下会导致系统频繁唤醒autovacuum launcher,消耗CPU
1
2
3
4
5
6
7
8
9
10
11
12
13
14
15
16
17
18
19
20
21
22
23
with a as (
(select 'pg_stat_activity' as src, xact_start, usename,datname, query, backend_xid, backend_xmin
from pg_stat_activity
where backend_xid = xid(pg_snapshot_xmin(pg_current_snapshot()))
or backend_xmin = xid(pg_snapshot_xmin(pg_current_snapshot()))
order by xact_start limit 1 )
union all
(select '2pc' as src, prepared as xact_start, owner as usename, database as datname, gid as query, transaction as backend_xid, transaction as backend_xmin
from pg_prepared_xacts
where transaction = xid(pg_snapshot_xmin(pg_current_snapshot()))
order by prepared limit 1 )
)
select * from a order by xact_start limit 1;
-[ RECORD 1 ]+------------------------------
src | 2pc
xact_start | 2021-09-07 16:08:30.962314+08
usename | postgres
datname | postgres
query | a
backend_xid | 26464724
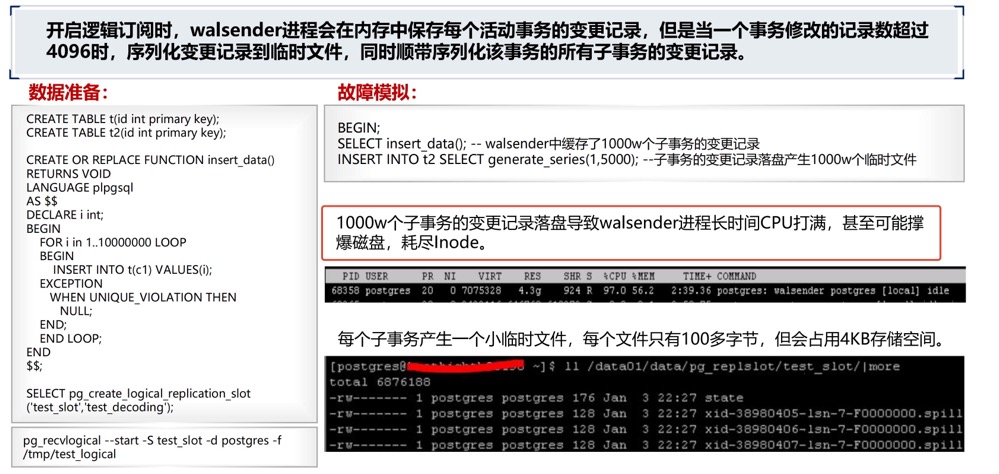
backend_xmin | 26464724walsender进程高消耗,典型场景大量子事务(超过了logical_decoding_work_mem)/多个订阅端(每个订阅端对应一个walsender),导致walsender进程持续100%
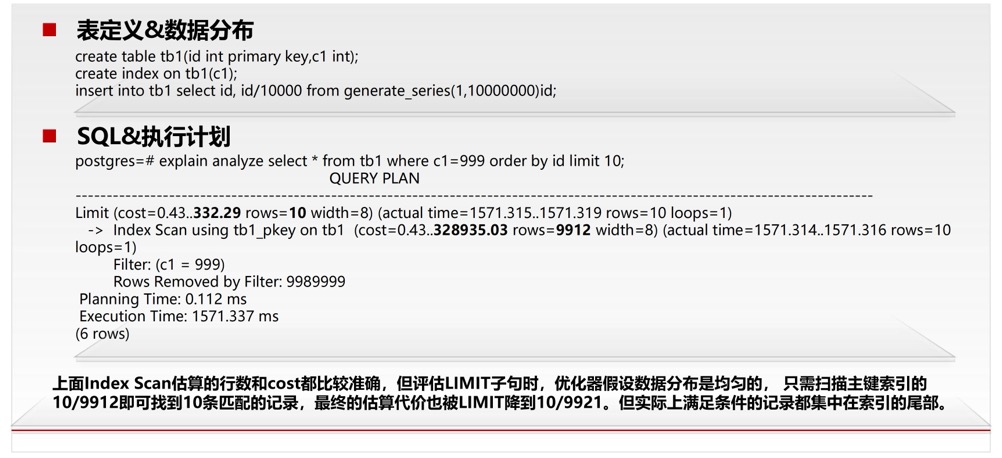
优化器误判
典型场景优化器认为数据是分布均匀的,但是假如实际情况是数据分布不均,比如全部聚集在尾部,那么就会出现问题,可以通过改写SQL:select * from tb1 where c1=999 order by id+0 limit 10;,这样就不会走索引,可以参考案例 👉🏻:分页查询/limit,一个有趣的SQL优化案例
https://ottertune.com/blog/how-to-fix-slow-postgresql-queries/
BUG
索引损坏,导致SQL持续100%,参考案例 生产案例 | 损坏的索引
硬件层
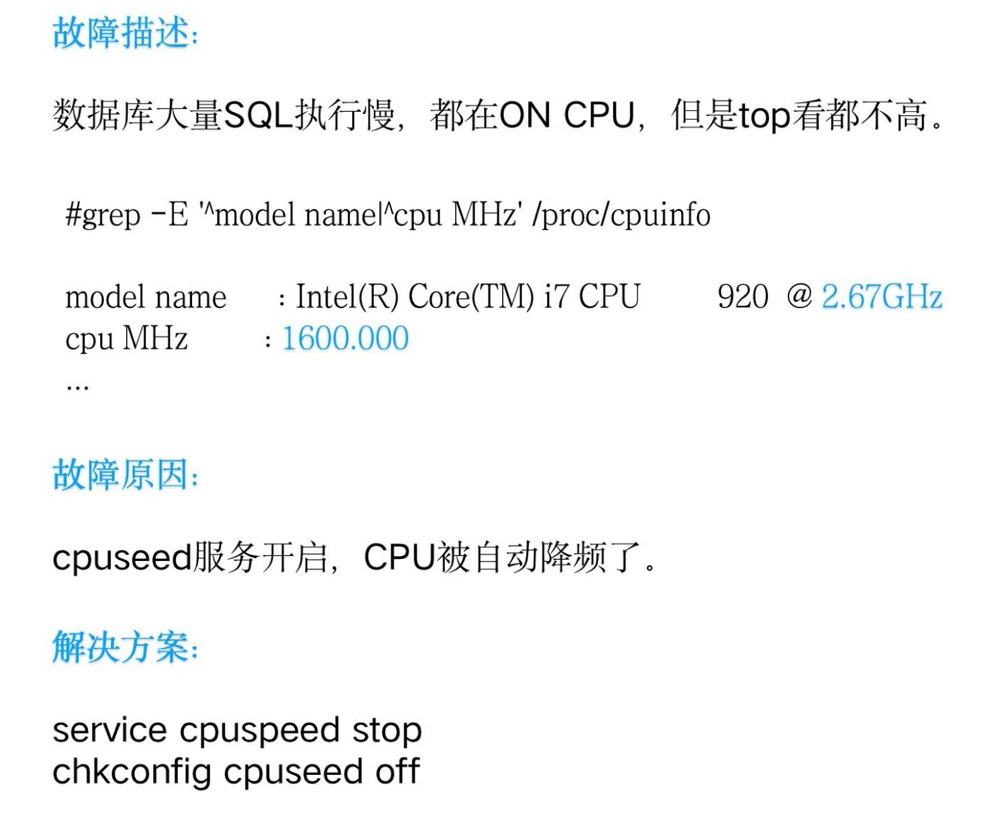
性能模式
CPU是否开启了节能模式,是否会自动降频
内存不足
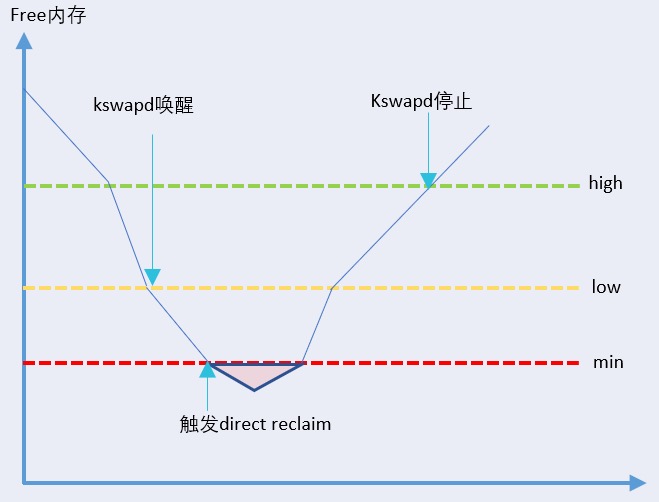
kswapd进程CPU持续100%,当整机free内存低于黄线low阈值时,内核的异步内存回收线程kswapd开始被唤醒,kswapd会在其他进程申请内存的同时回收内存。当整机free内存触达红线min阈值时,触发整机直接内存回收,所有来自用户空间的内存申请将被阻塞住,线程状态同时转换为D状态。此时只有来自内核空间的内存申请可以继续使用min值以下的free内存。后续当整机free内存逐步恢复到绿线high阈值以上后,kswapd线程停止内存回收工作。
对于内存不足可以观察是否是页表过大/内存消耗过大,数据库元信息是否膨胀等